Appliances & Heat
Farinograph
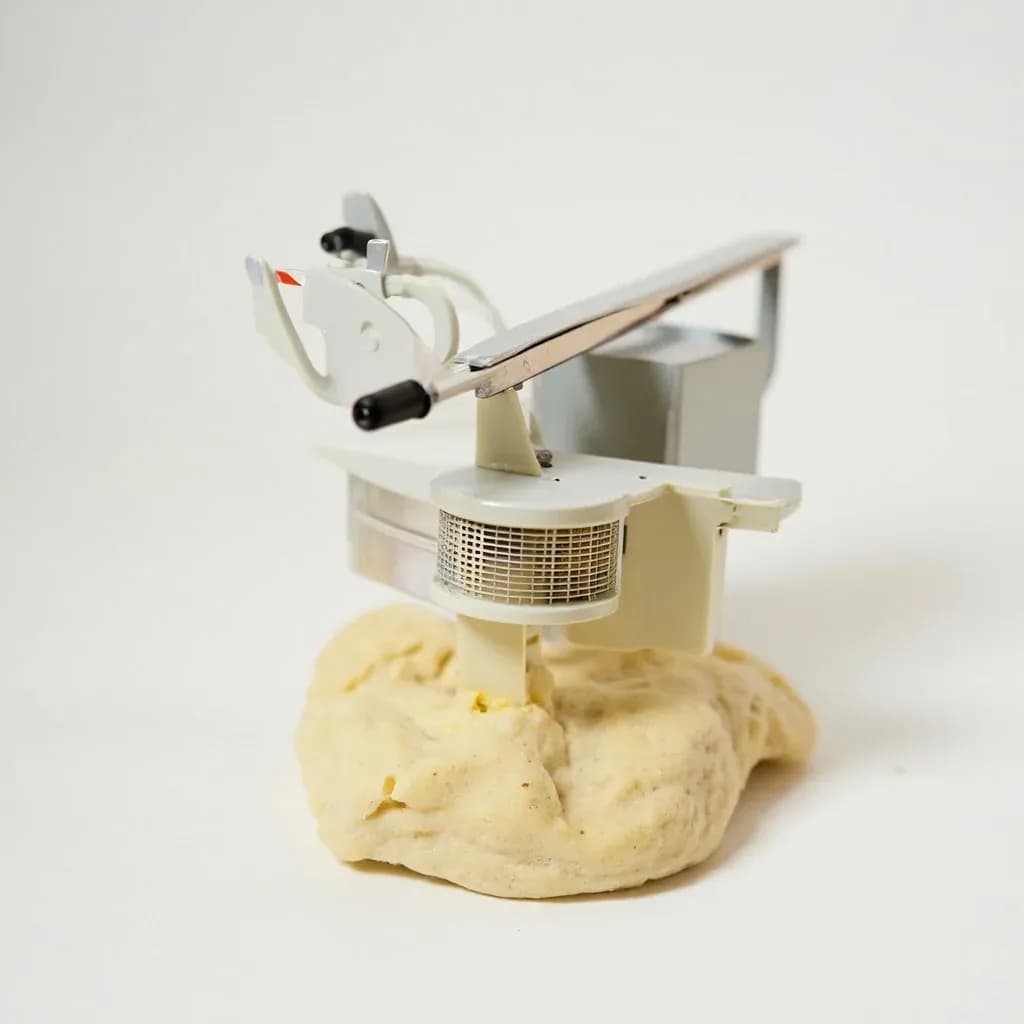
A lab instrument that measures dough's water absorption and mixing strength as it kneads.
A farinograph is a testing instrument that mixes flour and water into dough while recording the resistance over time. The resulting curve tells millers and bakers the flour's water absorption, dough development time, and stability, which predict baking performance. It is a quality-control tool used in flour mills and baking research rather than everyday cooking.
The Farinograph is a laboratory dough mixer with a built-in torque meter. Two counter-rotating Z-shaped (sigma) blades turn at a fixed 63 rpm inside a temperature-controlled bowl while a sensor records the resistance the dough puts up against the paddles. That resistance, plotted against time, is the farinogram — a continuous curve that tells a miller or baker how a flour behaves as it is being mixed: how thirsty it is, how quickly its gluten organizes, how long it holds up, and when it starts to break down. It is the cereal chemist's equivalent of a stress test for flour.
Although it looks like a small commercial mixer, the Farinograph is a cereal-science instrument, not a kitchen appliance. Its real value is reproducibility. Run the same flour under the same protocol — 300 g at 14% moisture, distilled water at 30 °C, ICC 115/1 or AACC 54-21.02 — and you get a curve identical to the one produced in a mill or university lab a continent away. That curve is how the industry decides whether a wheat shipment is bread-grade, whether an enzyme addition is helping or hurting, or whether a new flour blend can be hydrated the way the production line expects.
For working bakers, the Farinograph is most useful as a vocabulary: the words "water absorption," "dough development time," "stability," and "mixing tolerance index" all come from its curve, and knowing what they mean helps decode any flour spec sheet.
Alternatives
Types & varieties
Current production model with automatic water dosing and computerized curve evaluation.
Touch-screen successor to earlier analog/digital units, paired with MetaBridge software for analysis and storage.
Compact 50 g-bowl micro version for breeding programs, R&D, or limited samples.
Historical Brabender mechanical predecessor — essentially the pre-electronic Farinograph.
Not a Farinograph but its closest functional cousin: a pin-mixer recorder using only 10–35 g of flour, favored in wheat breeding and small bakeries.
Brabender's pilot-scale recorder that bridges lab Farinograph data and real bakery mixers.
Reading the Farinogram
The curve moves through four recognizable stages, and each has a name that shows up on every flour spec sheet. Once you can picture them, a number in a data table becomes a description of how the dough will feel.
- Arrival time — the moment the top of the curve first hits the 500 BU line. This is the point at which the flour and water have formed a coherent dough; before it, the mix is just wet flour.
- Peak (dough development time) — the highest point of the curve, usually reached in 2–8 minutes for bread wheat. It represents maximum dough strength under the test's slow mixing; the gluten network is at its most organized.
- Stability — the length of time the curve stays at or near the peak, measured in minutes. Strong bread flours hold 10–20 minutes; weak or damaged-starch flours may hold 2–3. Stability is the single best predictor of how the dough will tolerate overmixing on a real production line.
- Mixing tolerance index (MTI) — the drop in BU from the peak, measured 5 minutes after the peak (or at a defined end-point). A small drop means a tolerant dough; a steep drop means the gluten is tearing and the dough is going slack. Breakdown, reported as the drop at 12 minutes past peak, is the related end-of-run measure.
Common uses
Tips & pitfalls
- Always condition flour to a known moisture (typically 14%) and weigh on that basis; flour that has been sitting in a humid lab will read several percent higher in absorption than it really is.
- Use freshly distilled water at exactly 30 °C. A 1–2 °C shift measurably changes the curve, especially with weak or damaged-starch flours.
- Clean the bowl and blades thoroughly and dry them between runs — residual dough, flour, or detergent from a prior test is one of the most common silent sources of bad data.
- Run a reference flour (a check sample of known bread-making wheat) periodically to verify the instrument has not drifted; old mechanical units in particular lose dynamometer stiffness over years of use.
- Don't equate the Farinograph peak with the dough being ready in a real mixer. The slow sigma blades underestimate gluten strength relative to a high-speed spiral, so Farinograph peak times generally overstate how long dough will need on an industrial spiral.
- Report at minimum four numbers: water absorption (% at 14% moisture basis), dough development time, stability, and MTI. These cover most QC decisions and line up with how millers and ingredient suppliers communicate.
- For whole-grain, high-ash, or enzyme-active flours, expect longer development times and higher absorption than refined-wheat standards suggest — the curve is doing real work, not failing.
- Calibrate the dynamometer annually; mechanical fatigue in aging units is a frequent and easily missed source of inconsistent BU readings.
Good to know
- Origin
- Developed in Germany by Carl Heinrich Brabender; first commercial unit released around 1928–1930 by Brabender OHG, Duisburg.
- Primary maker
- Brabender GmbH & Co. KG (Germany); "Brabender Units" (BU) are named for the company, not the dough or the instrument's function.
- Standard methods
- ICC 115/1, AACC 54-21.02, and ISO 5530-1 define the official test protocol, sample weight, and reporting units.
- Measurement units
- Torque reported in Brabender Units (BU); modern digital units also output Nm and export curves via software such as MetaBridge.
- Sample size
- 300 g of flour at 14% moisture basis for the standard bowl; 50 g for the Farinograph-E micro version.
- Mixing action
- Two counter-rotating sigma (Z-blade) paddles at a constant 63 rpm in a temperature-controlled jacketed bowl.
- Test conditions
- Distilled water at 30 °C; runs typically last 12–20 minutes, ending after a defined stability window or fixed end-point.
- Key curve points
- Arrival time, peak (dough development time), stability, mixing tolerance index (MTI), and breakdown.
Also called
farinograph · dough rheometer
Related

Stovetop
The everyday burners where most cooking actually happens

Oven
Enclosed dry heat for roasting, baking, and braising

Grill
Live-fire or gas grates for char, smoke, and high heat

Smoker
Low, slow heat and wood smoke for barbecue and brisket

Air Fryer
Countertop convection that crisps with little or no oil

Slow Cooker
Set-and-forget low heat for stews, beans, and braises

Pressure Cooker
Sealed steam pressure that cooks tough food in a fraction of the time

Rice Cooker
Foolproof, perfectly steamed rice every single time